
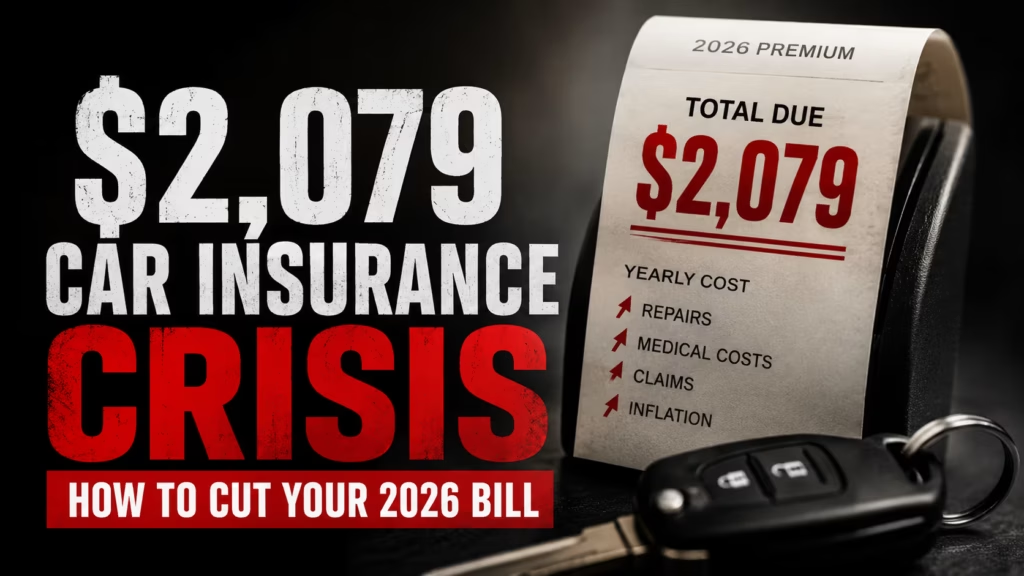
The median cost to insure a single vehicle in the United States is now $2,079 per year. That is $173 every month, before fuel, maintenance, or loan payments. For context, that figure rivals the average rent on a two-bedroom apartment in markets like Indianapolis or Columbus, and exceeds two months of groceries for a family of four under USDA moderate-cost plans. Yet most policyholders treat this bill as a fixed cost they cannot influence. That assumption is costing Americans billions.
Key Takeaway: The $2,079 median premium reflects a market-wide affordability crisis driven by inflated repair costs, climate losses, litigation inflation, and credit-based pricing disparities. Drivers in Louisiana and Florida now pay over $3,300 annually, while Vermont and Wyoming remain under $1,400. The most effective immediate countermeasures are: switching to usage-based insurance for low-mileage drivers, raising deductibles to $1,000, improving your credit-based insurance score, and shopping regional carriers that undercut national brands by 15-25% in high-cost states. A driver with a clean record who actively optimizes these variables can realistically reduce a $2,079 premium to $1,400-$1,600 without sacrificing liability protection.
This is not a temporary spike. The forces pushing premiums upward are structural: semiconductor shortages have extended repair timelines from five days to nineteen days on average, according to CCC Intelligent Solutions. Advanced driver-assistance systems (ADAS) have turned a $1,200 fender-bender into a $4,800 repair. Medical claim severity per bodily injury claim has risen 34% since 2020, per the Insurance Information Institute (III). And in tort states like Louisiana and Florida, litigation frequency has outpaced inflation, with plaintiff attorneys increasingly targeting policy limits rather than actual damages.
The result is a two-tier market. Drivers who understand the mechanics of modern underwriting are cutting their bills by 20-40%. Everyone else is subsidizing them.
📖 Navigate This Guide:
- Why Did Car Insurance Reach $2,079 in 2026?
- Which States Pay the Most for Car Insurance?
- How Much of Your Income Goes to Auto Insurance?
- Is It Legal to Drive Without Insurance If You Cannot Afford It?
- Can I Lower My Premium Without Cutting Coverage?
- Why Does a Poor Credit Score Cost More Than a DUI?
- What Happens If I Cancel My Car Insurance to Save Money?
- How Do I Find the Cheapest Car Insurance in 2026?
- When Should I Drop Comprehensive and Collision Coverage?
- Which Insurance Companies Offer the Best Rates in High-Cost States?
- Your 2026 Crisis Survival Action Plan
Why Did Car Insurance Reach $2,079 in 2026?
The figure did not appear overnight. It is the cumulative output of five converging pressures that reshaped the U.S. auto insurance market between 2020 and 2026.
Repair Cost Inflation and the ADAS Tax
Modern vehicles are safer, but they are also more expensive to fix. A cracked windshield on a 2024 Honda CR-V with a camera-mounted lane-keeping sensor does not cost $280 anymore. It costs $1,100 because the windshield itself is a calibrated optical component. Bumpers with embedded radar units add $800-$1,400 to what used to be a $600 body-shop visit. The National Association of Insurance Commissioners (NAIC) has documented that physical damage claim severity rose 28% from 2021 to 2025, and the trajectory has not flattened. In practice, a minor rear-end collision that would have settled for $2,400 in 2019 now generates a $5,200 claim.
Medical Severity and Litigation Frequency
Bodily injury liability claims are the single largest driver of base-rate increases. The III reports that the average bodily injury payout has climbed to $22,500 per claim, up from $16,800 in 2020. In no-fault states like Florida and Michigan, personal injury protection (PIP) fraud and excessive medical billing have forced insurers to raise rates preemptively. In tort states, nuclear verdicts exceeding $10 million have become common enough that reinsurance costs for primary auto carriers have risen, and those costs flow directly to policyholders.
Climate Losses Redrawing Risk Maps
Comprehensive coverage is no longer priced on historical averages. Insurers now use catastrophe models from CoreLogic and RMS to project future flood, wildfire, and hurricane losses at the ZIP-code level. In Florida, Citizens Property Insurance has absorbed so much risk that private auto carriers are raising comprehensive deductibles and adding named-storm exclusions. In California, non-renewals in wildland-urban interface zones have pushed drivers into the California Automobile Assigned Risk Plan (CAARP), where premiums are 40-60% above market.
Post-Pandemic Driving Behavior Normalization
During 2020-2021, accident frequency dropped 20% as miles driven collapsed. Insurers issued rebates and lowered rates. By 2023, traffic volume had rebounded past 2019 levels, but driving behavior had deteriorated. The National Highway Traffic Safety Administration (NHTSA) recorded the highest fatality rate per 100 million miles in fifteen years. Speeding, distracted driving, and red-light violations all increased. Insurers responded with broad rate increases that continued into 2026.
Reinsurance and Investment Income Pressure
Auto insurers do not just collect premiums; they invest them. When interest rates were near zero, carriers relied on underwriting profit. As the Federal Reserve raised rates, investment income improved, but catastrophe bond pricing and reinsurance capacity tightened after Hurricane Ian and the 2024 wildfire season. The net effect: carriers could not offset rising claims costs with investment returns, so they pushed rate filings through state insurance departments at the fastest pace since 2008.
Which States Pay the Most for Car Insurance?
The geographic variance in auto insurance is extreme. A driver in Louisiana pays 2.4x more than a driver in Vermont for identical coverage limits. Understanding why requires looking beyond population density into legal frameworks, weather exposure, and regulatory environments.
In practice, a 35-year-old driver with a clean record, a 2022 Toyota Camry, and 100/300/100 liability limits will pay $3,180 in Miami-Dade County, $1,950 in Austin, $1,320 in Denver, and $1,080 in Boise. The same human, the same car, the same coverage — four wildly different prices. This is why national advertising promising average savings is meaningless without state-level context.
How Much of Your Income Goes to Auto Insurance?
Nationally, auto insurance consumes 2.55% of median household income. That sounds manageable until you realize the median masks severe regional inequality. In Louisiana, where the median household income is roughly $57,000 and the median premium is $3,342, the burden is 5.9%. In Mississippi and Florida, it approaches 5%. By contrast, Massachusetts drivers spend closer to 1.8% despite high nominal premiums, because median incomes are significantly higher.
The Federal Trade Commission (FTC) and the Consumer Financial Protection Bureau (CFPB) have both flagged auto insurance affordability as a consumer protection issue. When a mandatory product consumes 5% of a household’s budget, trade-offs become painful. The Zebra’s 2026 State of Insurance report found that 57% of drivers have reduced discretionary driving to save fuel and wear, and 45% would raise deductibles or reduce coverage if premiums climbed another 10%. For Gen Z drivers, that figure jumps to 48% willing to cancel coverage entirely — a catastrophic decision with legal and financial consequences.
Is It Legal to Drive Without Insurance If You Cannot Afford It?
No. With two narrow exceptions, driving without liability insurance is a criminal or civil offense in every U.S. jurisdiction.
🔸 States with Mandatory Insurance
- 48 states + D.C. require minimum liability coverage, typically 25/50/25 or higher
- Penalties: Fines ($150-$5,000), license suspension, SR-22 filing, vehicle impoundment
- Mississippi and Tennessee use online verification systems that flag uninsured vehicles in real time
- Texas charges up to $1,000 for repeat offenses plus annual SR-22 surcharges
🔸 Exceptions & Alternatives
- New Hampshire: No mandatory insurance, but drivers must prove financial responsibility after an at-fault accident
- Virginia: Allows uninsured driving if you pay a $500 annual Uninsured Motorist Fee — but you remain personally liable for all damages
- California CLCA: Low-cost program for income-eligible drivers (liability only, income under 250% federal poverty level)
- New Jersey SAIP: Special Automobile Insurance Policy for Medicaid-eligible drivers
In practice, the $2,079 premium is cheaper than the alternative. A first-time uninsured driving conviction in California carries a $360-$720 fine plus penalty assessments, a suspended license, and impound fees that can exceed $1,200. An at-fault accident while uninsured exposes you to personal liability judgments, wage garnishment, and asset seizure. The risk-reward math is unambiguous: find a way to stay insured, even if it means switching to state minimums temporarily.
Can I Lower My Premium Without Cutting Coverage?
Yes, and this is where experienced drivers separate themselves from the market average. There are eight levers that do not require reducing your liability limits or dropping physical damage coverage.
Why Does a Poor Credit Score Cost More Than a DUI?
This is the most politically charged pricing mechanism in auto insurance, and it affects more drivers than any traffic violation.
In 27 states, a driver with poor credit pays a median of $1,805 more per year than an identical driver with excellent credit. That gap exceeds the surcharge for a single DUI in many jurisdictions. The reason is actuarial, not moral: credit-based insurance scores — calculated from payment history, credit utilization, length of credit history, and recent inquiries — correlate strongly with claim frequency. The NAIC has validated this correlation across decades of data. A driver who struggles to manage revolving debt is statistically more likely to file a claim, miss premium payments, or allow coverage to lapse.
The disparity is staggering in practice. In Texas, a driver with excellent credit might pay $1,420 for full coverage. The same driver with poor credit pays $2,940. A DUI conviction adds roughly $1,100 annually for three years. The credit penalty is nearly double and persists indefinitely until the score improves.
Consumer advocates argue this practice is regressive, penalizing drivers for economic circumstances outside their control. Several states agree. California, Hawaii, Massachusetts, and Michigan have banned or severely restricted the use of credit in auto insurance pricing. Washington and Oregon have considered similar legislation. But in the majority of states, credit remains a primary pricing pillar.
Strategic response: If you live in a credit-permissive state, treat your insurance score with the same urgency as your FICO score. Pay all bills on time, reduce credit card balances below 30% of limits, avoid opening new accounts before shopping for insurance, and dispute any errors on your LexisNexis or TransUnion insurance reports. A 50-point improvement can save $600-$1,000 annually.
What Happens If I Cancel My Car Insurance to Save Money?
Canceling coverage is the nuclear option, and the fallout lasts years.
A coverage gap of even one day triggers a “lapse” flag in the Comprehensive Loss Underwriting Exchange (CLUE) database, which nearly every insurer queries at quote time. When you reapply, carriers classify you as high-risk. Expect a 20-50% surcharge for the lapse alone, applied for six to twelve months. If the gap exceeds 30 days, some non-standard carriers will refuse to quote you entirely, forcing you into assigned-risk pools with premiums 40-100% above market.
If you are caught driving uninsured, penalties escalate rapidly:
The Zebra’s 2026 survey found that 29% of drivers considered canceling coverage if premiums rose 10%, but only 4% actually did so. The gap between intention and action reflects an intuitive understanding that the consequences outweigh the savings. If you are genuinely unable to afford coverage, explore state low-income programs, reduce to state minimum liability, increase deductibles to the maximum, or sell the vehicle and use public transit. Cancellation is not a viable financial strategy.
Get Your 2026 Car Insurance Quotes
Lock in today’s best rates before the next wave of trend-driven price changes. Compare telematics, pay-per-mile, and traditional policies in one step.
GET YOUR 2026 CAR INSURANCE QUOTESHow Do I Find the Cheapest Car Insurance in 2026?
Finding the cheapest policy requires methodical comparison, not a single quote on a Sunday afternoon. The variance between the highest and lowest quote for the same driver in the same ZIP code routinely exceeds $1,200 annually.
Step 1: Standardize Your Coverage Limits
Before requesting quotes, decide on your target limits. For most drivers, 100/300/100 liability (bodily injury per person / per accident / property damage) provides adequate protection without over-insuring. For physical damage, choose a deductible you can afford out-of-pocket: $1,000 is the sweet spot for most households. Requesting quotes with identical parameters is the only way to compare apples to apples.
Step 2: Cast a Wide Net
Obtain quotes from at least five categories of carriers:
- National direct writers: GEICO, Progressive, USAA (if eligible) — heavy digital infrastructure, competitive for clean records
- National agency writers: State Farm, Allstate, Farmers — strong local agent networks, competitive bundling discounts
- Regional carriers: Erie, Auto-Owners, Cincinnati Insurance, Farm Bureau — often 15-25% cheaper in their footprint states
- Insurtech / direct-to-consumer: Lemonade, Root, Clearcover — streamlined apps, competitive for low-mileage urban drivers
- Non-standard / high-risk specialists: The General, Dairyland, Bristol West — necessary if you have violations, lapses, or poor credit
Step 3: Verify Financial Stability and Service Quality
Price is not the only variable. Check the NAIC Complaint Ratio, which measures complaints relative to market share. A ratio below 1.0 indicates fewer complaints than expected. Also review A.M. Best financial strength ratings; you want a carrier rated A- or higher to ensure claim-paying ability after a catastrophe.
Step 4: Time Your Shopping
Insurers file new rates quarterly. Shopping 30 days before renewal puts you in the “new business” window, where carriers offer acquisition discounts to win your policy. Waiting until the day before expiration leaves you with no leverage and potential lapse risk.
Step 5: Negotiate with Your Current Carrier
Before switching, present your lowest competitive quote to your current insurer’s retention department. Many carriers have unpublished “price match” authority for valued customers, especially if you have been claim-free for three or more years. This five-minute phone call has saved policyholders $200-$400 without changing companies.
When Should I Drop Comprehensive and Collision Coverage?
This is one of the most common questions from drivers of aging vehicles, and the answer is mathematical, not emotional.
The standard rule: drop full coverage when your vehicle’s actual cash value (ACV) falls below 4-6 times your annual premium for comprehensive and collision combined. If comp and collision cost you $900 per year and your car is worth $3,200, you are paying 28% of the vehicle’s value annually for protection with a $1,000 deductible. In a total-loss scenario, the insurer pays $2,200 ($3,200 ACV minus $1,000 deductible). Over three years, you paid $2,700 in premiums to protect a $2,200 payout. The math does not work.
✅ Keep Full Coverage If:
- Vehicle ACV exceeds $6,000
- You cannot afford to replace the vehicle out-of-pocket
- You have a loan or lease (lender requires it)
- You live in a high-theft ZIP code
- You drive in areas with frequent deer or wildlife collisions
❌ Consider Dropping If:
- Vehicle ACV is below $4,000
- Annual comp/collision premium exceeds 15% of ACV
- You have an emergency fund covering replacement cost
- The vehicle is a secondary or recreational vehicle
- You are comfortable assuming the risk of total loss
Important exception: if you drop collision and retain only liability, you lose protection against uninsured motorists who damage your vehicle. In states with high uninsured driver rates (Florida: 20.4%, Mississippi: 29.4%), carrying uninsured motorist property damage (UMPD) coverage becomes essential even without collision. UMPD is typically inexpensive — $50-$100 annually — and closes the gap left by dropping collision.
Which Insurance Companies Offer the Best Rates in High-Cost States?
There is no single “cheapest” insurer nationally. The carrier that dominates Ohio may be uncompetitive in Louisiana. In high-cost states, regional knowledge separates the winners from the overpayers.
In practice, the best approach is to obtain quotes from one national direct writer, one regional carrier, and one independent agent with access to non-standard markets. The agent can often place you with a surplus-lines carrier (like Dairyland or Bristol West) if standard markets decline. The premium difference between a standard carrier and a surplus-lines policy for the same driver can be $800-$1,500 annually — but if you have a DUI, lapse, or poor credit, surplus-lines may be your only path to legal coverage.
Your 2026 Crisis Survival Action Plan
The $2,079 median is a market average, not your destiny. Drivers who treat insurance as an actively managed expense consistently beat the median by 20-35%. Here is the exact sequence to follow this week.
Phase 1: Audit (30 Minutes)
Pull your declarations page. Write down your current premium, liability limits, deductibles, and every discount applied. Compare your premium to your state’s median using NAIC or III data. If you are paying more than 150% of your state median, you are overpaying. Also request your credit-based insurance score from LexisNexis and TransUnion. Dispute any errors immediately.
Phase 2: Optimize (1 Hour)
Complete a state-approved defensive driving course online ($25-$50, 6-8 hours). Raise your deductibles to $1,000 if you have an emergency fund. Verify your annual mileage and update your policy if you drive less than 7,500 miles. If you work from home, emphasize this to every carrier you quote. Enroll in paperless billing and paid-in-full annual payment for additional discounts.
Phase 3: Quote and Negotiate (2 Hours)
Request identical quotes (100/300/100 liability, $1,000 deductible) from five carriers: one national direct, one national agency, one regional, one insurtech, and one independent agent. Record every quote in a spreadsheet. Check NAIC complaint ratios and A.M. Best ratings. Present your best quote to your current carrier’s retention department. If they cannot match within 10%, switch.
Phase 4: Monitor Quarterly
Insurance rates change quarterly. Set a calendar reminder to re-shop every six months. If your credit score improves, request a mid-term rate review. If you move to a lower-risk ZIP code, update your policy immediately. The drivers who save the most are not the ones who shopped once — they are the ones who treat insurance as a recurring optimization task.
Get Your 2026 Car Insurance Quotes
Lock in today’s best rates before the next wave of trend-driven price changes. Compare telematics, pay-per-mile, and traditional policies in one step.
GET YOUR 2026 CAR INSURANCE QUOTESSources: National Association of Insurance Commissioners (NAIC), Insurance Information Institute (III), National Highway Traffic Safety Administration (NHTSA), Federal Trade Commission (FTC), Consumer Financial Protection Bureau (CFPB), The Zebra 2026 State of Insurance Report, CoreLogic Climate Risk Analytics, Moody’s Analytics Reinsurance Data, CCC Intelligent Solutions.